 Larus cachinnans
(last update:
Greg Neubauer
Marcin Przymencki
Albert de Jong
Mars Muusse
sub-adult cachinnans: December
Identification of Caspian Gulls: phenotypic variability and the field characteristics of hybrids
Summary of key findings
• Overall trait scores (i.e. the sum of individual trait values) for pure Herring and pure Caspian Gulls showed little (adult) or no (first-winter) overlap (FIG. 6 & FIG. 8). Frequency statistics indicate that these scores can be used to separate even the most extreme (atypical) first-winter birds and the vast majority (c. 99%) of adults with confidence.
• There was considerable overlap between pure Caspian and pure Herring Gulls in virtually all of the individual phenotypic characteristics examined. Consequently, traits have to be used in combination to help resolve the identification of difficult individuals.
• For adult Caspian Gulls, the most stable traits were the balance of black and white in P10 and the colour of the pale tongue on this feather. Our analysis indicates that any gull showing more black than white in P10 and a tongue of similar shade to the mantle should not be identified as a Caspian Gull.
|
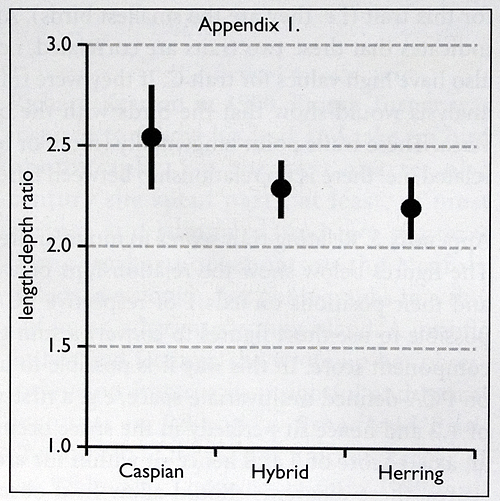
• First-winter Caspian Gulls varied enormously, with few stable traits. The traits most useful for separation from Herring Gull were bill shape (length/depth ratios), greater-covert pattern, scapular moult and primary projection. Nonetheless, species’ scores for each of these traits overlapped to some degree, indicating that they should not be used in isolation.
• Many first-winter Caspian Gulls were well streaked on the head and body and had heavily marked scapulars. Many birds also had rather dark underwings. Despite the variability of these traits, resulting in some birds having high scores for one or two of them, the sum scores did not overlap between species. This indicates that the scoring system is robust to the variability of individual traits.
• Many of the F1 hybrids had intermediate sum scores and occupied intermediate multivariate space. By combining sum scores and evidence from the PCA, it should be possible to establish whether a given bird is phenotypically outwith the range of pure species and hence should not be identified as either Herring or Caspian Gull. However, some F1 and most F2 hybrids and backcrosses fell within the space occupied by pure individuals. It is likely that at least some of these birds would simply go undetected. At the moment it seems that there is no way of confidently recognising them in the field.
• There was considerable variability in our small sample of hybrids, such that this sample is likely to be insufficient to fully establish their true heterogeneity. Given this and the limited multivariate space remaining between pure species, we conclude that in reality there must be considerable overlap between hybrids and pure individuals.
• The problem posed by hybrids (as indicated by their trait scores) suggests that a conservative approach to field identification is warranted. Specifically, we recommend that only adult gulls with a sum trait score of less than 9 and first-winters scoring less than 22 are safely identifiable as Caspian outside its main range. These conservative values will mean that a minority of pure individuals will not be considered acceptable. These thresholds, however, may be refined in the future as our understanding of the phenotypic characteristics of hybrids improves, and / or refinements to the scoring system are made.
Appendices
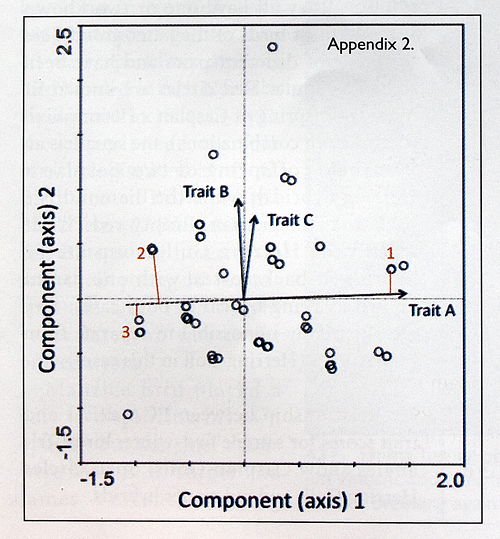
Appendix 2. Principal Component Analysis (PCA).
PCA is a method of data reduction and has been used widely to help understand patterns in complex (multivariate) datasets. It integrates variation (information) contained in pure, raw variables (e.g. measurements) into fewer, synthetic variables called Principal Components (PCs). It finds linear combinations of the raw measurements which maximise the variation present within them, and summarises this in PCs (the first two of which are represented as axes on a two-dimensional diagram). In essence, it finds an optimum way of capturing the variability in multidimensional data and represents this in a smaller number of dimensions. Some unavoidable information loss occurs during the process of computing principal components, and so it is necessary to provide the percentage of the total variation ‘explained’ (captured) within particular components. Typically, the first few components (axes) are the most important in terms of explaining the original variation: PC1 explains the largest amount of variation contained in the original data, the second (PC2) explains less, and so on. The ideal situation is when PC1 and PC2 (i.e. axes 1 and 2 on the diagram) together capture most of the total variation in the data. A key advantage of PCA is that it does not require the data to be normally distributed (Zuur et al. 2007).
Output from a hypothetical Principal Component Analysis is shown in the diagram below. It visualises the distribution of a number of sample birds (dots) and the traits (arrows A-C) used to characterise each one. In this example, trait A can be interpreted as being the most important one in driving the overall differences between the birds, because it has the longest arrow. Conversely, trait C, because it has the shortest arrow, varies least between the birds and so is not responsible for the major differences between them. Trait B is intermediate, but clearly less important than A and rather similar to C in the proportion of the overall variance that it explains. Trait A lies nearly parallel with the horizontal axis (PC1) and so the separation of birds from left to right in the diagram relates to their values of this trait. The arrowheads point in the positive direction of the trait values; thus, if trait A was the overall size of the bird, then larger birds would be to the right. For example, bird 1 in the figure is a large bird as it sits close to the end of the trait arrow (where it falls on the arrow is shown by the vertical red line). Traits radiate from the origin (0,0), and by convention are shown only in their increasing (positive) direction. The equivalent part of the trait arrow going in the opposite direction, on the other side of the origin, is not normally shown. This decreasing part of the arrow has to be visualised as the 180° projection of the increasing one, back through the origin. Just for illustrative purposes here, this decreasing line tor trait A is shown as a dashed line in the figure. Birds 2 and 3 sit at the extreme end of this negative line and so have the lowest values in the sample for this trait (i.e. they are the smallest birds). Arrows for traits B and C lie very close together. This indicates that these two traits are correlated, i.e. those birds which have high values for trait B will also have high values for trait C. If they were traits related to bill and leg brightness, for example, the analysis would show that the birds with the brightest legs also have the brightest bills, and vice versa. These traits point tangentially (more or less 90°) to trait A. This means that they are not correlated, i.e. there is no relationship between bare-part brightness and the size of the bird.
Appendix 3. Relating trait scores to multivariate space.
The figures below show the relationships between the sum of the trait scores for individual birds and their positions on axis 1 of respective PCAs. By reading from the fitted regression lines, it is possible to use these figures to convert a sum trait score derived for a candidate Caspian Gull to a component score. In this way it is possible to use the diagrams to see where a candidate bird plots on PCA-defined multivariate space, e.g. a first-winter bird scored as 15 should have an axis 1 score of 1.2 and hence sit perfectly in the space occupied by Caspian, while a bird scored as 25 will have an axis 1 score of 0 and hence sit within the area occupied by hybrids. By converting sum to axis 1 scores, these diagrams should allow field observers to reach a well-informed decision about the identification of a problem bird, based on its position in true multivariate space.
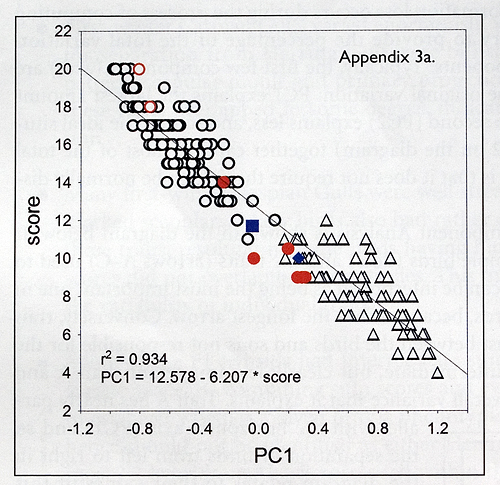
3a. Relationship between PCA axis 1 and trait scores for sample adult gulls. The principal component value can be approximated by the equation given on the scatter; while the correlation is not ideal (as some portion of original variation was captured by further principal components), it is very high and sufficient to show that scores characterize phenotype well enough to detect between-species differences. By reading from the regression line, it is possible to convert a sum trait score to a PC1 position, and thus locate a bird within multivariate space. Known hybrids are given by red and blue symbols: they all have one or two known parents (most birds of the latter group), are offspring of different pairs and have been scored as adults. Red circles are known F1 hybrids (offspring of Caspian x Herring Gull
pairs in both combinations), the square is an F2 hybrid (offspring of two Caspian x Herring hybrids), while the diamond is a backcross to Caspian. Empty red circles within the Herring Gull group are F2 hybrids or backcrosses, with one parent known as being hybrid in both cases; they are apparently impossible to separate from pure species (Herring Gull in this case).
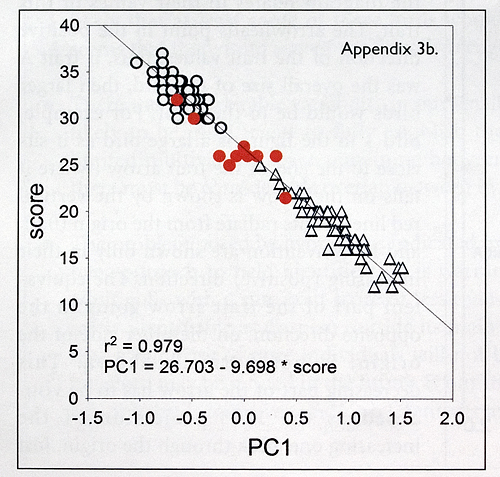
3b. Relationship between PCA axis 1 and trait scores for sample first-winter birds. Triangles show Caspian Gulls, open circles Herring Gulls and red circles hybrids.
 Larus cachinnans 4CY UKK L-005760 December 11-12 2012, Oss, the Netherlands. Picture: Theo Muusse & Lützen Portengen.
 Larus cachinnans hybrid 4CY & 5CY 07P2 December 17 2009 and January 14 2010, Pohlsche Heide, Germany. Picture: Armin Deutsch.
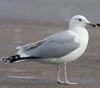
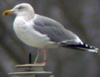 Larus cachinnans hybrid 4CY-7CY 81P1 December 2009 - November 2012, Roermond, the Netherlands.
 Larus cachinnans 4CY & 8CY 7P16 February 06 2007, December 11 2007 & December 07 2011, Mur de Lixhe, Belgium. Picture: Charly Farinelle.
 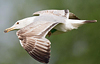 Larus cachinnans 2CY-4CY XNCD 2013-2015, France & the Netherlands. Picture: Pierre Tillier, Ran Schols & Willy Raitière.
 Larus cachinnans 3CY-5CY PLG DN-03919 January 2006 - November 2008, Deponie Pohlsche Heide - Minden, Germany (52°23'05N, 08°46'45E).
 Picture: Armin Deutsch.
 Larus cachinnans sub-adult, 01 December 2011, Boulogne-sur-Mer, NW France, Picture: Jean-Michel Sauvage.
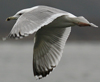 Larus cachinnans sub-adult, December 29 2009, Westkapelle, the Netherlands. Picture: Ies Meulmeester.
 Larus cachinnans 4CY, December 21 2012, Ashdod, Israel. Picture: Amir Ben Dov.
 Larus cachinnans sub-adult, December 21 2012, Ashdod, Israel. Picture: Amir Ben Dov.
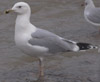 Larus cachinnans sub-adult, December 02 2008, Dambovita canal, Bucharest. Picture: Cristian Mihai.
 Larus cachinnans sub-adult, December 23 2010, Ashdod, Israel. Picture: Amir Ben Dov.