 Larus cachinnans
(last update:
Greg Neubauer
Marcin Przymencki
Albert de Jong
Mars Muusse
 sub-adult cachinnans: April
In 2011, Chris Gibbins, Grzegorz Neubauer and Brian Small published two extensive papers in Britsih Birds, dealing with Caspian Gull. Below, you will find the content of the second paper "phenotypic variability and the field characteristics of hybrids".
The full title reads: From the Rarities Committee's files - Identification of Caspian Gull. Part 2: phenotypic variability and the field characteristics of hybrids, by Chris Gibbins, Grzegorz Neubauer and Brian Small, IN: BB 104/2011. ORDER PAPER COPY!
"we" in the text below refers to the original authors. If any errors occur in this text, please let me know and mail to marsmuusseatgmaildotcom.
PART 1: ABSTRACT & INTRODUCTION
PART 2: APPROACH
PART 3: ADULT BIRDS AND FIRST WINTER BIRDS
BELOW: PART 4 OF THE PAPER
Identification of Caspian Gull. Part 2: phenotypic variability and the field characteristics of hybrids
Data analysis
The variability of individual traits, and hence the extremes recorded in each species, was assessed simply by looking at the frequency statistics for individual trait scores. Each bird was also given an overall score, calculated by summing the scores across all traits. Species were then compared by looking at patterns in sum scores. These simple analyses permitted an assessment of the magnitude and nature of variability in the traits typically used to identify Caspian Gulls, and consequently overlap between species in either individual traits or sum scores.
Principal Component Analysis (PCA) was used to visualise patterns of variability between individual birds in a truly multivariate way and to help identify (statistically) those traits which are most useful for distinguishing the two species. Appendix 2 gives further details of this technique. PCA produces an easy-to-interpret, two-dimensional diagram (an ordination biplot) in which the distances between samples (birds) reflect the overall similarity of each individual to all other individuals. This overall similarity is calculated by integrating all the measured characteristics, in our case the quantitative values (scores) of each trait. On the diagram, traits are represented as arrows, with the length of the arrow for a given trait being proportional to its importance in driving patterns of similarity between sample birds.
Fundamentally, we were interested in assessing:
(1) the extent to which Caspian and Herring Gulls separated out on the PCA biplots; and
(2) the relative positions of hybrids.
Interpreting this PCA together with the individual trait scores gives us a quantitative basis for deciding whether a particular extreme individual can be identified safely or not. We do not expect that birders will analyse candidate birds using PCA, and so we also present a means of placing a given bird in PCA-defined multivariate space using its trait score (Appendix 3). In this way, the position of a given bird relative to pure and hybrid individuals can be determined quickly and easily.
Identification of adult birds
Table 3 summarises statistical data on the frequency of different trait scores for adult gulls. The following text uses those data to assess the reliability of features used to identify Caspian Gulls. The focus is on the extreme values and the extent of overlap between the species at these extremes.
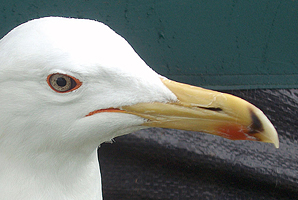
 Larus argentatus argenteus 5cy male, 05 May 2006, Moerdijk, the Netherlands. Picture: Theo Muusse. Bill dimension: 2,33 = intermediate (ratio 2.0-2.39) = trait score 2. |
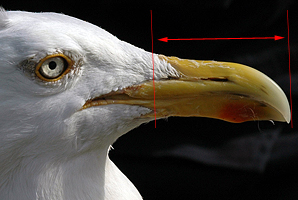
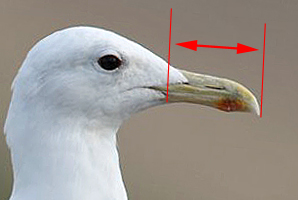
 Larus cachinnans 6CY female, May 2005, Włocławek Reservoir, central Poland. Picture: Magdalena Zagalska-Neubauer. Bill dimension: 3,11 = very long and slim, with little/no visible gonydeal angle (L:D ratio >2.8) = trait score 0. |
 Larus argentatus argenteus 5cy male, 23 May 2006, Moerdijk, the Netherlands. Picture: Theo Muusse. Bill dimension: 2,29 = intermediate (ratio 2.0-2.39) = trait score 2. |
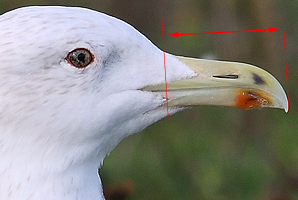 Larus cachinnans adult male, November 10 2010, Boulogne-sur-Mer, NW France, Picture: Jean-Michel Sauvage. Bill dimension: 2,51 = slim, slight gonydeal angle (ratio 2.4-2.79) = trait score 1. |
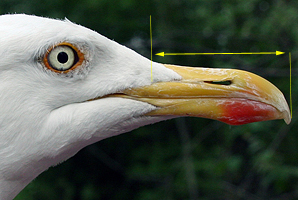 Larus argentatus argenteus adult female, 05 May 2006, Moerdijk, the Netherlands. Picture: Theo Muusse. Bill dimension: 2,44 = slim, slight gonydeal angle (ratio 2.4-2.79) = trait score 1. |
 Larus cachinnans adult female, August 2008, Riga, Latvia. Picture: Chris Gibbins. Bill dimension: 2,81 = very long and slim, with little/no visible gonydeal angle (L:D ratio >2.8) = trait score 0. |
 Larus argentatus argenteus adult male, March 19 2010, IJmuiden, the Netherlands. Picture: Mars Muusse. Leg length = short = trait score 2. |
 Larus cachinnans 5CY, August 18 2010, Lubna, Poland. Picture: Michal Rycak. Leg length = long = trait score 0. |
 Larus argentatus argenteus adult female, June 01 2011, IJmuiden, the Netherlands. Picture: Mars Muusse. Leg length = short = trait score 2. |
 Larus cachinnans 5CY female, January 17 2008, Fußach (Fussach), Austria. Picture: Stephen Aubry. Leg length = short = trait score 2. |
Variability in structure
The basic differences in structure between Caspian and Herring Gull were outlined in part 1 (Gibbins et al. 2010). The quantitative data from our sample birds indicate that bill shape and leg length contribute to species separation (table 3) and so are good clues to identification. Caspian Gulls had higher bill length/depth ratios than Herring Gulls, indicative of proportionally longer and slimmer bills with a less marked gonys (fig. 4). While 87% of Caspian Gulls had slim bills (trait score 1), 92% of Herring Gulls had bills that were either short and deep with a well marked gonydeal angle (score 3) or slightly longer but still relatively stout (score 2). None of the sample Caspian Gulls had short and deep bills (score 3) but 8% of Herring had slim bills (score 1). Thus, while there were overall differences in trait-score frequencies between the species, there was also a degree of overlap.
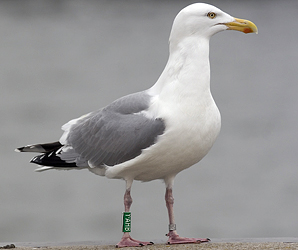
Leg length was clearly different between Caspian and Herring Gulls overall, with typical trait scores apparent for each species. In the sample, 52% of Caspian Gulls had long legs (score 0) versus 5% of Herring Gulls; conversely, while only 2% of Caspian Gulls had short legs (score 2), 45% of Herring Gulls did so. However, about half of all individuals fell in the intermediate category (score 1), indicating considerable overlap in relative leg length.
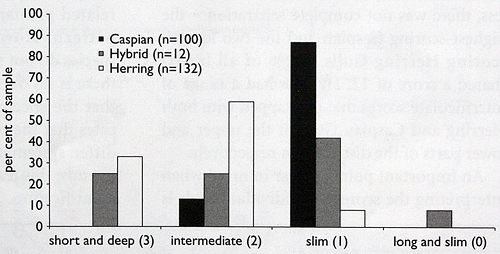
Fig. 4. Length to depth bill ratios for sample adult birds. The ratio values (0-3) relate to the trait categories described in table 1.
| Bill shape | 0 | very long and slim, with little/no visible gonydeal angle (L:D ratio >2.8) |
| 1 | slim, slight gonydeal angle (ratio 2.4-2.79) | |
| 2 | intermediate (ratio 2.0-2.39) | |
| 3 | short and deep, well-marked gonydeal angle (ratio <2.0) |
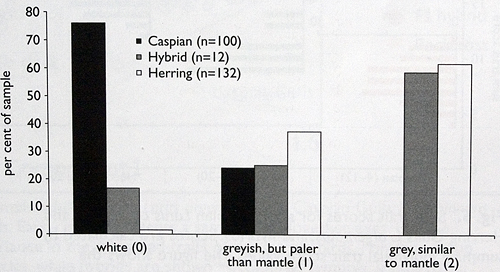
Fig. 5. Trait scores for P10 tongue colour tone for sample adult birds.
| P10: tongue | 0 | white or whitish |
| 1 | paler than mantle | |
| 2 | same shade as mantle |
END OF PART 4
CONTINUE PART 5: VARIABILITY IN PLUMAGE (IN ADULTS)
 Larus cachinnans 4CY female UKK T-001671 April 28 2012, Minsk Gatovo roofcolony, Belarus. Picture: Dmitry Goncharov.
 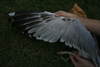 Larus cachinnans 4CY male 746P April 28 2008, Włocławek Reservoir, central Poland. Picture: Magdalena Zagalska-Neubauer.
 Larus cachinnans PCEE 4CY, February & April 2014, Wandre, Belgium & Zastow Karczmiski, Poland. Picture: Łukasz Bednarz & Walther Leers.
  Larus cachinnans PHDL 4CY, April 24 2014, Zastow Karczmiski, Poland. Picture: Łukasz Bednarz.
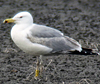 Larus cachinnans PHEE 4CY, April 14 2014, Łęczna landfill, Poland. Picture: Łukasz Bednarz.
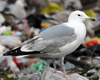 Larus cachinnans 4cy, 08-13 April 2009, Riga, Latvia. Picture: Chris Gibbins.
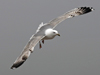 Larus cachinnans 4cy, 08-13 April 2009, Riga, Latvia. Picture: Chris Gibbins.
 Larus cachinnans 4cy, 08-13 April 2009, Riga, Latvia. Picture: Chris Gibbins.
 Larus cachinnans sub-adult, April 28 2012, Gatovo - Minsk, Belarus. Picture: Dmitry Goncharov.