 Larus cachinnans
(last update:
Greg Neubauer
Marcin Przymencki
Albert de Jong
Mars Muusse
 sub-adult cachinnans: September
In 2011, Chris Gibbins, Grzegorz Neubauer and Brian Small published two extensive papers in Britsih Birds, dealing with Caspian Gull. Below, you will find the content of the second paper "phenotypic variability and the field characteristics of hybrids".
The full title reads: From the Rarities Committee's files - Identification of Caspian Gull. Part 2: phenotypic variability and the field characteristics of hybrids, by Chris Gibbins, Grzegorz Neubauer and Brian Small, IN: BB 104/2011. ORDER PAPER COPY!
"we" in the text below refers to the original authors. If any errors occur in this text, please let me know and mail to marsmuusseatgmaildotcom.
PART 1: ABSTRACT & INTRODUCTION
PART 2: APPROACH
PART 3: ADULT BIRDS AND FIRST WINTER BIRDS
PART 4: DATA ANALYSIS
PART 5: VARIABILITY IN PLUMAGE (OF ADULTS)
PART 6: IDENTIFICATION OF FIRST WINTER BIRDS
PART 7: VARIABILITY IN EXTENT OF POST-JUVENILE MOULT
PART 8: UNDERWING PATTERN
BELOW: PART 9 OF THE PAPER: DISCUSSION
Identification of Caspian Gull. Part 2: phenotypic variability and the field characteristics of hybrids
Discussion
This paper represents the first fully quantitative analysis of patterns of phenotypic variability in adult and first-winter Caspian Gulls, relative to Herring Gulls and hybrids between these species. We scored more than 400 birds using plumage, moult and structural traits and analysed patterns of variability in individual traits and sum scores. We used PCA to plot pure and hybrid birds in multivariate phenotypic space and assess the traits most responsible for the intra- and interspecific variability observed in our sample.
The main point about the scoring system is that it has allowed us to quantify the patterns of variability in individual traits and the extent of overlap between species. However, the system may also be useful for records committees, should they feel it appropriate in their area, to help with assessment of less typical birds. These two points are elaborated in the discussion that follows.
Trait scores and the use of the scoring system
The frequency statistics in tables 3 and table 4 allow birders to determine how unusual a trait present in a candidate bird actually is. This is a critical starting point for tackling the identification of a less typical individual. Particularly for first-winter birds, the data show that some traits, traditionally thought to be useful for separating the species, are not wholly reliable on their own because of the degree of overlap. Rather than necessarily seeing this overlap as a problem for field identification, we prefer to use it to suggest that certain criteria used in record assessment should be relaxed. Perhaps most obviously, it is clear that a virtually unmarked white head and body should not be a prerequisite for a record of first-winter Caspian Gull – many Caspian Gulls (16% of our sample) were actually rather well streaked (trait score 3). Similarly, some first-winters had heavily chequered greater coverts, so this feature alone should not automatically rule out a candidate bird. Bill structure, leg length and the presence of a ventral bulge are all useful features for identification of typical birds, but the statistics show a considerable overlap; for example, a bird with a typical Herring Gull-like bill (trait score 2) can easily be a Caspian. For adults, there was much overlap in the extent of black within the white tip of P10 and across P5, so neither of these traits should be seen as being critical for field identification.
Despite the overall success of the approach we have used, it must be stressed that it remains simplistic. This simplicity was dictated primarily by the need to ensure its application to birds seen in the field. With trapped birds, more detailed measurements permit the application of more sophisticated and powerful approaches (for example, those used in Gay et al. 2007 and Neubauer et al. 2009). It is clear that individual observers might score the same bird slightly differently; as a consequence, while we have developed an approach that allows a bird’s phenotype to be characterised as objectively as possible, there remains an element of subjectivity. Polarised scoring systems are essentially linear and, through careful choice of traits and their scores, are capable of representing the transition (in scores) from one species to another and of identifying the points across this transition occupied by hybrids between the two. By their very nature they are not able to assess the similarity of a third species to these two if it does not sit somewhere on the same overall transition line. In essence, this is because the full set of traits used to separate two species are not the same set used to separate a third species from each of these. Consequently, it has not been possible to incorporate Yellow-legged Gull in our system.
Application of the scoring system ideally requires that all traits are visible in photographs or at least have been recorded in the field. If not, then observers or committees may have to judge whether, without full details, a bird is acceptable. A full discussion of this issue is beyond the scope of this paper, but it may still be possible to use the system to score such a bird partially and to use that score to help reach a decision. For example, if the partial score (primary projection not seen) of a first-winter gull is 19 (with its score not including a value for primary projection), that bird would in any event fall within the range of Caspian Gull, since the upper limit for Caspian is 25 and the primary projection score runs from 0 to 3.
Defining boundaries for the safe identification of Caspian Gull
There is frequent debate on internet forums over ‘problem birds’. In many cases these debates go unresolved because the views being put forward lack an objective or quantitative basis - opinion and counter opinion fuel interesting but ultimately inconclusive debate. Although we recognise that many birders will not find the statistical approach outlined in this paper to their liking, it does provide an objective basis to allow such debates to be resolved. We stress that rather than amounting to ‘identification by numbers’ it merely formalises a process that we already attempt when confronted with a less typical individual gull; the formalization is required because we cannot otherwise deal with multiple traits simultaneously and quantitatively, especially when it comes to subtle hybrids. Thus, we prefer to see our system as a supportive tool, rather than a fundamental shift in the approach to bird identification. Records committees have discussed such formalisation previously, for other species groups, but for a variety of reasons have generally retained more traditional approaches to record assessment. However, because they are so individually variable, and because of the issues posed by hybrids, we feel that a more quantitative approach is justifiable for assessing Caspian Gull records.
The results of our study are perhaps fully satisfying for a statistician, owing to the very different mean values and virtually non-overlapping distributions of the sum scores of pure individuals. For birders interested in the identification of problem birds, this indicates that separation of the vast majority of pure Caspian and Herring Gulls should be possible using sum scores. At the same time, our data represent the classic picture of hybrid intermediacy very well - all proven hybrids had sum scores roughly in between the pure species. However, given the range of the scores of pure individuals, it is also clear that there is very little ‘space’ remaining for hybrids to fit into. Consequently, one would have to be fortunate to find a hybrid that fell neatly between the distributions of pure Herring and Caspian Gulls.
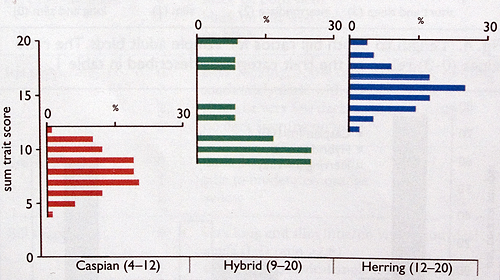
Fig. 6. Sum trait scores for adult Caspian Larus cachinnans and Herring Gulls L argentatus, and hybrids. Scores are calculated by summing individual trait score values. The figure shows the percentage of individuals in the sample with a given sum value. Numbers in parentheses are the minimum and maximum values recorded.
The number of hybrids included in our sample was constrained by their abundance in the study colonies. Despite the limited sample size, however, hybrids showed a degree of variability comparable with pure individuals. What we infer from this is that, because there is little sum-score space left between pure individuals of the two species, the true distribution of hybrid scores must overlap considerably with Herring and Caspian. While this s an interesting finding in its own right, it can also be used to define safe boundaries for the identification of pure individuals. For adult birds, it is clear (fig. 6) that a bird with a score of less than 9 should be pure Caspian, while one with a score of 9 or more is not safely identifiable as a Caspian. For first-winter birds (fig. 8), the upper limit for pure Caspian was 25, while the lowest score for a proven hybrid was 22. Thus, we suggest that 21 should mark the upper limit of safe first-winter Caspian (as birds with scores of 22-25 could be either pure Caspian Gulls or hybrids).
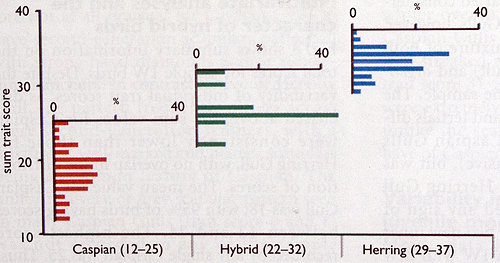
Fig. 8. Sum trait scores for first-winter Caspian Larus cachinnans and Herring Gulls L. argentatus, and hybrids. Scores are calculated by summing individual trait score values. The figure shows the percentage of individuals in the sample with a given sum value. Numbers in parentheses are the minimum and maximum values recorded.
The application of these values would mean that some pure individuals (those with scores overlapping with those of hybrids) would not be considered acceptable. Such birds appear from our sample data to be rare in populations, so we might expect that Western Europe is visited far more frequently by ‘safe’ Caspian Gulls (i.e. adults with scores less than 9, first-winters with scores less than 22) than by these extreme individuals from the tails of the distribution. Given that the phenotype of known hybrids shows considerable variation (i.e. the maximum and minimum values in figs. 6 and 8), we suggest that safe identification of Caspian Gull, at least in areas where it constitutes a rarity or scarce migrant, should be accompanied by scores.
The proximity of arrows on a PCA biplot shows how strongly correlated the variables are. For first-winter birds, we ran the Caspian Gull data on its own through a PCA to assess the degree of correlation between traits. This analysis indicated that, of the plumage traits, scapular pattern and overall darkness scores are correlated. Consequently, a Caspian Gull which has lots of dark streaking on the head and body is statistically likely to have strongly marked second-generation scapulars too. This is highly relevant for field identification. When confronted with a bird that appears rather too heavily streaked on the head and body to be a likely candidate, it is logical to look at some other traits to help with the identification. If the bird also has heavily marked scapulars, the temptation might be to dismiss it because it shows two ‘atypical’ traits. However, the PCA indicates that these characters tend to go hand in hand, and that the combination of a dark head and body and heavily marked scapulars does not automatically rule out Caspian.
In general, adult hybrids had a shorter bill and more black in P10 than Caspian Gulls, and frequently the spotting on their irides was so delicate that they would look pale-eyed in the field. Scores for many of the individual traits overlapped between pure Caspian and pure Herring Gulls. In effect this means that, for individual traits, there are no intermediate scores that are characteristic of hybrids (as such scores can also be shown by pure individuals). The phenotypic intermediacy of hybrids was evident only when multiple traits were examined simultaneously. The PCA indicated that in terms of their overall phenotype, some hybrids really are intermediate, so extreme caution is needed when tackling them in the field. One known and two presumed adult backcross hybrids were extremely similar to parental phenotypes. While the adult F1 hybrids were rather uniform in phenotype, F2 hybrids and back-crosses must show a higher degree of phenotypic variation because of recombination and segregation. In these hybrids, new combinations of genotypes arise, ones that are never present in the parental or F1 hybrid generation, as well as genotypes identical to parental ones (see Price 2008). Therefore, both F2 hybrids and backcrosses are likely to look either like pure species or like intermediates. It seems very likely that such birds simply go undetected in the field.
END OF PART 9
CONTINUE PART 10: KNOWLEDGE GAPS
 Larus cachinnans sub-adult, 04-12 September 2009, Preila, Lithuania. Picture: Chris Gibbins.
 Larus cachinnans sub-adult, 04-12 September 2009, Preila, Lithuania. Picture: Chris Gibbins.
 Larus cachinnans sub-adult, 04-12 September 2009, Preila, Lithuania. Picture: Chris Gibbins.
 Larus cachinnans sub-adult, 04-12 September 2009, Preila, Lithuania. Picture: Chris Gibbins.
 Larus cachinnans sub-adult, 04-12 September 2009, Preila, Lithuania. Picture: Chris Gibbins.
 Larus cachinnans sub-adult, 04-12 September 2009, Preila, Lithuania. Picture: Chris Gibbins.
 Larus cachinnans sub-adult, 04-12 September 2009, Preila, Lithuania. Picture: Chris Gibbins.
 Larus cachinnans sub-adult, 04-12 September 2009, Preila, Lithuania. Picture: Chris Gibbins.
 Larus cachinnans sub-adult, 04-12 September 2009, Preila, Lithuania. Picture: Chris Gibbins.
 Larus cachinnans sub-adult, September, Lithuania. Picture: Chris Gibbins.
 Larus cachinnans sub-adult, September, Romania. Picture: Chris Gibbins.
 Larus cachinnans sub-adult, September 10-20 2010, Preila Pier - Neringa Spit, Lithuania. Picture: Chris Gibbins.