|
|||||||||||||||||||||||||||||||||||||||||||||||||||||||||||||||||||||||||||||||||||||||||||||||||||||||||||||||||||||||||||||||||||||||||||||||||||||||||||||||||||||||||||||||||||||||||||||||||||||||||||||||||||||||||||||||||||||||||||||||||||||||||||||||||||||||||||||||||||||||||||||||||||||||||||||||||||||||||||||||||||||||||||||||||||||||||||||||||||||||||||||||||||||||||||||||||||||||||||||||||||||||||||||||||||||
Coordinators: 1cy July 2cy Jan 3cy Jan 4cy / sub-ad Jan adult Jan |
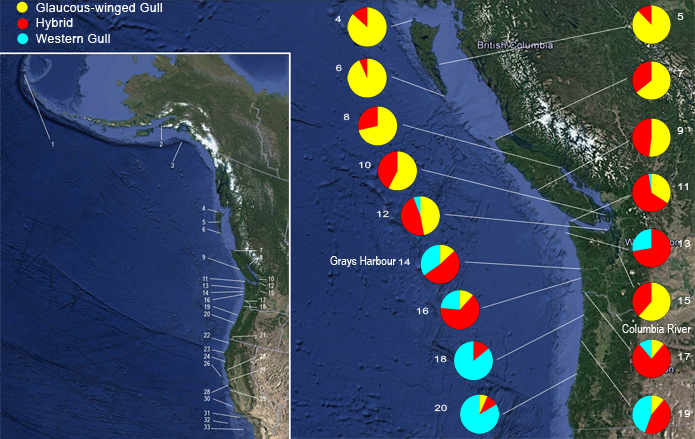
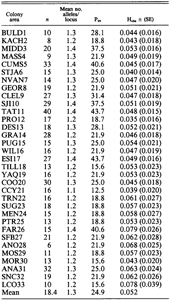
adult: JanuaryThe Condor 98:527-546, 1996 GENETIC DIFFERENTIATION, GEOGRAPHIC VARIATION AND HYBRIDIZATION IN GULLS OF THE LARUS GLAUCESCENS-OCCIDENTALIS COMPLEXDOUGLAS A. BELL (Museum of Vertebrate Zoology, University of California at Berkeley) INTRODUCTIONA central tenet of evolutionary biology is the origin of species through geographic subdivision of populations (Mayr 1963). Subdivision of populations into disjunct units spread out over great distances is thought to permit local differentiation via stochastic and deterministic processes that may lead to reproductive isolation and speciation (Endler 1977). When contact between divergent populations is reestablished, hybrid zones can form with resultant consequences for the evolutionary trajectories of the interbreeding populations (Barton and Hewitt 1989, Arnold 1993, Harrison 1993). For instance, if hybrid fitness is high, introgression can be extensive and the hybridizing populations may become panmictic over time, resulting in the formation of a hybrid swarm in place of the original taxa. Recent work in avian systems has shown that hybridizing taxa may experience bouts of gene exchange without becoming panmictic, especially if interbreeding is restricted in geographical or chronological scope (e.g., Parsons et al. 1993). Under such circumstances hybrid zones may function as conduits for gene exchange between species and thereby serve to increase overall levels of genetic and phenotypic diversity (Grant and Grant 1992, 1994, Moore and Price 1993, Parsons et al. 1993, Pierotti and Annett 1993). Clearly, such evidence has far reaching implications for biological species definitions because it suggests that the genetic systems of vertebrates may be prone to more introgression and lateral gene transfer than previously thought. Populations of large, white-headed Larus gulls provide an excellent system for the study of differentiation and introgression because hybridization occurs frequently within the genus (see Pierotti 1987). However, aside from the recent work of Snell (1991a, 1991b), nearly all previous gull hybrid zone research suffers from two major shortcomings: This paper presents a multidimensional approach to the study of hybridization between the Glaucous-winged Gull (Larus glaucescens) and the Western Gull (Larus occidentalis). Geographic variation in calorimetric (plumage and soft-part colors) and morphometric characters is assessed by univariate and multivariate statistical methods. Protein electrophoresis is used to investigate population genetic structure and gene Bow within the complex. The use of external characters to identify hybrids is tested and, following classification by canonical discriminant function analysis, interspecific genetic differentiation is assessed. Results from these analyses are used to infer the position of the hybrid zone and the evolutionary history of the Larus glaucescens-occidentalis complex. The breeding distribution of Larus glaucescens extends from the east coast of the Kamchatka Peninsula across the Aleutian chain and the Gulf of Alaska south through coastal British Columbia and Washington to northwestern Oregon (AOU 1983). Larus occidentalis breeds from Juan de Fuca Strait and the outer Washington coast south through Oregon, California and the west coast of Baja California (AOU 1983). The two species hybridize where their breeding ranges overlap along the Washington and northern Oregon coasts (Scott 1971, Hoffman et al. 1978). In addition, L. glaucescens hybridizes with the Slaty-backed Gull (L. schistasagus) on the Korjak shore of Kamchatka (Firsova and Levada 1982) and the Herring Gull (L. argentatus) in southern and southeastern Alaska (Williamson and Peyton 1963, Patten and Weisbrod 1974, Patten 1980). Larus glaucescens is also thought to hybridize with the Glaucous Gull (L. hyperboreus) along the eastern Bering Sea coast of Alaska (Strang 1977). Patten (1980) refers to L. glaucescens as a “key” taxon because it potentially links several of the northern Pacific Rim gulls. MATERIALS AND METHODSSAMPLING DESIGN AND ANALYSIS Field work was carried out from 1985 to 1990 during the breeding season in coastal Alaska, British Columbia, Washington, Oregon, California, and Baja California. Thirty-three “colony areas,” each including one or more collecting localities, was established throughout the allopatric and sympatric breeding ranges of L. glaucescens and L. occidentalis (Table 1, Fig. 1). Gulls were collected at nests or from sea or land points near colonies. Freshly collected birds were classified a priori in the field as either pure or hybrid based on general appearance in plumage and softpart coloration (see Hoffman et al. 1978). A total of 704 specimens of L. glaucescens, L. occidentalis, and their hybrids was collected, and an additional 58 specimens (wing preparations) were received on loan from the Burke Museum at the University of Washington. As a null hypothesis, all members of the Larus glaucescens-occidentalis complex were assumed to be invariant throughout their breeding range. Demonstration of significant geographic variation would lead to the rejection of the null hypothesis. In addition, the data were first analyzed under the assumption that each colony area was panmictic. Thus, no assumptions about taxonomic affinities were made, all specimens within each colony area were pooled, and the colony areas were analyzed population-by-population. This approach facilitated the testing of hypotheses concerned with overall variation in the complex, the shape of character clines, and HardyWeinberg equilibria within populations. Discriminant function analysis was then used to classify specimens to taxon (= morphotype) a posteriori. Each class of a posteriori-designated morphotype was then subjected to further analyses on intraspecific and interspecific levels.
FIGURE 1.
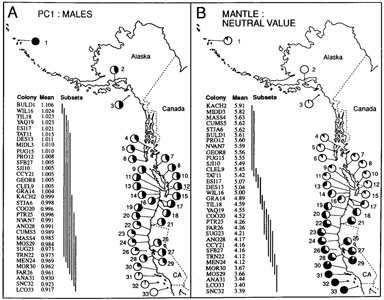
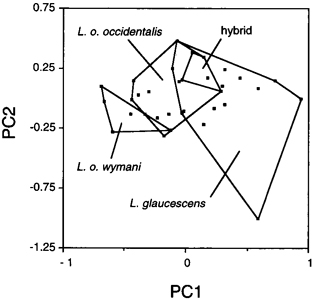
MORPHOMETRIC AND COLORIMETRIC ANALYSIS Mensural characters. Color characters. Each Munsell color is defined by three characters - hue, value, and chroma. From these, dominant wavelength (DW), percent spectral reflectance or brightness (Y), and excitation purity (PE), respectively, can be obtained with the aid of conversion tables (Munsell 1968). Newhall et al. (1943) and Bowers (1956) discuss the basis for these conversions. For examples on the use of Munsell color notations in avian systematic studies, see Hellack and Schnell (1977) and Smith (1987). Endler (1990) discusses the limitations inherent in color determinations based on visual inspection of color chip standards. Abbreviations for the soft-part calorimetric characters analyzed here are: PIP0 = proportion of iris covered in dark pigment; BIY = bill color, brightness; BDW = bill color, dominant wavelength; BPE = bill color, excitation purity; EY = eyering, brightness; EDW = eye-ring, dominant wavelength, EPE = eye-ring, excitation purity; E2Y = second eye-ring, brightness; E2DW = second eye-ring, dominant wavelength; E2PE = second eye-ring, excitation purity; IY = iris, brightness; IDW = iris, dominant wavelength; IPE = iris, excitation purity; PY = iris pigment, brightness; PDW = iris pigment, dominant wavelength; PPE = iris pigment, excitation purity. Numerical analysis. Prior to running statistical routines that are affected by scaling (see Sneath and Sokal 1973) mensural characters were log-transformed (Jolicoeur 1963) and calorimetric characters were standardized. Principal components analysis (PCA) of the variance-covariance matrix of 11 log-transformed mensural characters was used to summarize variation across all characters (SASPRINCOMP). Canonical discriminant function analysis (DFA) of calorimetric characters was employed to classify specimens into three groups separated by sex: putative L. glaucescens, L. o. occidentalis, and hybrids. The southern Western Gull, L. o. wymani (MOS29-LC033), was not included in the DFA. To calibrate the DFA, specimens collected from largely allopatric colonies were designated pure. Thus, specimens from BULD1 to STJA6 (see map, Fig. 1) were used to represent L. glaucescens, while those collected from colonies COO20 to AN028 represented L. o. occidentalis. Specimens collected from colony areas NVAN7 to YAQ19 were assigned to the hybrid calibration data set after removal of specimens considered to be putatively pure, based on a priori assumptions of plumage and soft-part color variation. To obtain a posteriori classifications, all specimens from colonies BULD1 through AN028, separated by sex, were then subjected to linear DFA (SAS-DISCRIM) using the pooled covariance matrix of Euclidean distance values calculated from the two plumage and 16 soft-part calorimetric characters described above. Calculating the a posteriori error rate probability permitted the classification of specimens of questionable pure or hybrid status. ALLOZYME ELECTROPHORESIS Sample preparation and laboratory procedures. Numerical analysis. Genetic substructuring of populations was investigated using F-statistics (Wright 1978, Nei 1977) and principal components analysis (Barrowclough and Johnson 1986). In the latter analysis, allellic frequencies of seven of the “most variable” loci (EST-2abc, EAP-1a, LAa, PAPab, MDPHab, G3PDHab, PGM-1a) at all 33 colonies were arcsine transformed before subjecting the resulting variance-covariance matrix to PCA. The genetic distance measures of Nei (1978) and Rogers (1972) were used to assess divergence between colony areas and taxa. Phenetic clustering of taxa based on genetic distance was accomplished using the unweighted pair-group method with arithmetic averaging (UPGMA; see Sneath and Sokal 1973). Quantitative estimates of gene flow were obtained using FST, a measure of intercolony variation in allele frequency averaged across all alleles, loci and colonies, to estimate Nm from the formula developed by Wright (1951): Nm = (1/FST - 1)/4, where N is the number of individuals in a population and m is their migration rate (individuals per generation). This formula assumes an infinite island model of population structure at equilibrium and neutral allelic variation (Wright 1951). MORPHOMETRIC AND COLORIMETRIC RESULTSMORPHOMETRIC VARIATION MANOVA revealed that all 11 mensural characters in the L. glaucescens-occidentalis complex are significantly sexually dimorphic, with males being on average 6-13% larger than females (Bell 1992). Mensural variation was therefore analyzed separately by sex. The 11 log-transformed mensural characters loaded positively on PC1 and variably on PC2 for each sex in the PCA (Table 2). This pattern of character loading implies that PC1 scores summarize mostly sizerelated variation, whereas PC2 scores summarize both size and shape variation (Marcus 1990). In both sexes, the total variance explained in the PCA is greater for PC1 than PC2 (Table 2). Plots of PC1 versus PC2 showed extensive overlap between morphotypes in the complex (Bell 1992). The SS-STP identified eight subsets of maximally non-significant means for male PC1 scores (pooled taxa), showing that although this multivariate measure of size varies within the complex, no pattern of significant clinal variation is evident due to extensive overlap of colony means (Fig. 2). Within the complex, however, males from the Aleutians Islands (BULD1) tend to be the largest, whereas those from the Channel Islands off southern California and Baja California (ANA31 to LCO33) tend to be the smallest. Females exhibit a smiliar trend in PC1 scores (Bell 1992). Univariate mensural characters, such as head, wing, and tarsus length, revealed similar patterns of variation in size in both sexes (Bell 1992). Extensive overlap between morphotypes of the L. glaucescens-occidentalis complex in British Columbia, Washington and Oregon, precluded using morphometric characters to discriminate hybrids from pure parentals.
FIGURE 2.
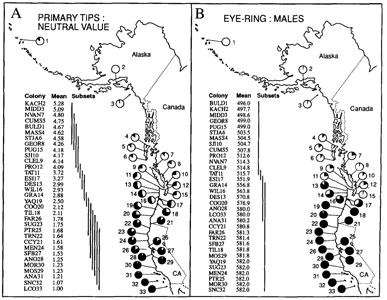
COLORIMETRIC VARIATION Results from the MANOVA revealed that one or more characters related to either bill, eye-ring, or iris color were sexually dimorphic (Bell 1992). As Pierotti (pers. comm.) pointed out, the bills of females appear “richer”, less “faded” in color than those of males. Males and females did not differ significantly in their respective distributions of neutral values for the mantle (Kolmogorov-Smirnov two sample test, D = 0.029, P > 0.05) and primary tips (K-S two-sample test, D = 0.069, P > 0.05). Therefore, the sexes were combined to study geographic variation in the population means of these two characters. Results from the SS-STP applied to colony means (pooled taxa) for mantle neutral value reveal significant clinal variation with latitude (Fig. 2), ranging from dark gray (mean = 3.39) at SNC32 in southern California to light gray (mean = 5.91) at KACH2 in Kachemak Bay, Alaska. Steps in colony means for mantle neutral value occur both within and between taxa. In L. o. wymani, gulls from the Channel Islands (LCO33 - AN030) have darker mantles than those from the central California coast (MOR30-MOS29). Another step in mantle neutral value occurs between L. o. wymani (MOS29) and L. o. occidentalis (AN028). From AN028 to CCY21, a region corresponding to pure L. o. occidentalis, mantle color remains fairly constant, but then increases in value, e.g., becomes lighter, in Oregon (CC020 to TIL18), due in part to the presence of hybrids and some L. glaucescens, but also due to clinal variation in L. o. occidentalis. For example, specimens of putatively pure L. 0. occidentalis from Washington and Oregon have significantly lighter mantles than those from northern California (WA & OR: MANTmean = 4.50; n = 75; CA: MANTmean = 4.18; n = 133; two-tailed ts = 11.45; P < 0.0001). Mantle color goes through an inflection point in colonies at the Columbia River and along the outer Washington coast (ESI17, WIL16, GRA14, DES13). These four colonies are included in the main region of sympatry. North of this zone, from TAT11 at the entrance to Juan de Fuca Strait to MASS4 in the Queen Charlotte Islands, and east into Puget Sound (PUG15) mantle color is substantially lighter, but relatively constant in mean colony value. A further step towards lighter mantle neutral values occurs between British Columbia (MASS4) and Alaska (MIDD3). Note that colony means for mantle color at STJA6 and BULD1 are nearly identical (Fig. 2). These colonies are at approximately the same latitude (52”) on opposite sides of the Pacific. Thus, Larus glaucescens may exhibit parallel latitudinal clines in mantle color along both eastern and western coasts of the northern Pacific Rim, although in the eastern Pacific introgression from L. schistasagus may also be influencing mantle color. Similar to the mantle, colony means (pooled taxa) for primary tip neutral value exhibit significant clinal variation (Fig. 3), ranging from near-black (mean = 1.00) at LCO33 to light gray (mean = 5.28) at KACH2. Steps in primary tip melanism occur at approximately the same geographic positions as in the mantle, and colony mean subsets appear to reveal an inflection point concordant with the concentrated region of sympatry on the outer Washington Coast (ESI17, WIL16, GRA14, and DES13). As in the mantle, primary tip melanism shows intraspecific clinal variation: a posteriori identified specimens of L. o. occidentalis from Washington and Oregon have significantly lighter primary tips than those from northern California (WA & OR: TIPmean = 1.96; n = 75; CA: TIPmean = 1.64; n = 133; two-tailed t, = 10.36; P < 0.0001). The dominant wavelength (DW) of eye-ring color showed little geographic variation within putative taxa for either sex (Fig. 3). Although most gulls possessed one pigment, either yellow (DW = 575-582 nm), as in L. occidentalis, or pink (DW = 493-5 10 nm), as in L. glaucescens, some of the hybrids possessed both pigments (yellow and pink). It was therefore necessary to calculate an average for each gull to account for double pigments. In both sexes colony means for average eye-ring DW undergo a jump in the space of 90 km along the outer Washington coast: that is, between DES13 (47”41’N) near La Push and TAT11 (48”23’N) near Cape Flattery. Eye-ring DW demarcates a main contact boundary between L. glaucescens and L. o. occidentalis. FIGURE 3.
FIGURE 4.
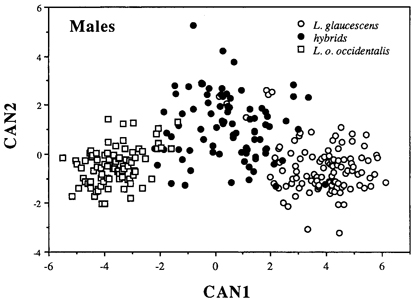
DISCRIMINANT FUNCTION ANALYSIS Canonical DFA using 18 calorimetric variables provided significant discrimination of putatively pure and hybrid gulls of both sexes. Because the results are nearly identical in both sexes, only males are illustrated (Fig. 4). The first canonical variate (CAN1) separated all three categories of gulls - L. glaucescens, L. o. occidentalis and hybrids - and accounted for 92.8 and 93% of the within-class variance in males and females, respectively (Table 3). The second canonical variate (CAN2) provided additional discrimination of some hybrids. Hybrids are clearly intermediate in canonical multivariate space between L. glaucescens and L. o. occidentalis, although the DFA provided better separation between hybrids and L. o. occidentalis than between hybrids and L. glaucescens (Fig. 4). Character loadings on each canonical axis signify the relative contribution of the character towards total canonical structure (Marcus 1990). Although most colorimeteric characters had high loadings on CAN1 and intermediate loadings on CAN2 (Table 3), some may serve as better discriminators than others. In both sexes, MANT and TIP load heaviest on CAN1 (r >= 0.90) suggesting that these two characters contribute the most toward discriminating between L. glaucescens, L. o. occidentalis and hybrids. In males, BDW also loads highly on CAN1. THE HYBRID ZONE Based on the a posteriori classification of specimens from the DFA, the hybrid zone between Larus glaucescens and Larus occidentalis is defined here to include all colonies where both species were collected as breeding birds (Fig. 1). This includes nine colony areas extending across 745 km of coastline from Protection Island (PRO12) in eastern Juan de Fuca Strait, Washington, west to Tatoosh Island (TAT11) at Cape Flattery, and then south along the coast to Coos Bay (COO20), Oregon. The zone of introgression refers to those colony areas where hybrids were collected as breeding birds, and includes all colonies in sequential order from the northern end of the Queen Charlotte Islands (MASS4), British Columbia, south to Coos Bay (COO20), Oregon. By these definitions, Puget Sound (PUG15) is excluded from the hybrid zone but included in the zone of introgression. Note that while the southern borders of the hybrid and introgressive zones coincide at Coos Bay, Oregon, the northern borders do not (Fig. 1). The hybrid zone ends at Juan de Fuca Strait, whereas the introgressive zone is continuous up to the Queen Charlotte Islands in British Columbia. Thus, the zone of introgression is skewed towards the north and east, that is, towards L. glaucescens. The midpoint of the hybrid zone is centered around Grays Harbor (GRA14), Washington. Given the vagaries of small sample sizes (Table 1), there are differences in the relative proportion of morphotypes at colonies within the hybrid and introgressive zones (Fig. 1). In the hybrid zone, for example, colony composition ranges from 7% to 47% L. glaucescens, 10% to 77% hybrid, and 6% to 86% L. o. occidentalis. The colony with the highest proportion of putative hybrids (77%) is East Sand Island (ESI17) located at the mouth of the Columbia River. This colony also contains equal proportions (11.5%) of L. glaucescens and L. o. occidentalis. The degree of putative introgression varies in the hybrid zone: north of Destruction Island (DES13) Washington, hybrids tend to be more glaucescens-like, south of East Sand Island (ESI17) at the mouth of the Columbia River, they tend to be more occidentalis-like (Bell 1992).
GENETIC RESULTSGENETIC VARIABILITY Of 32 loci scored across 33 colony areas (pooled taxa) within the Larus glaucescens-occidentalis complex, 25 (78%) were polymorphic. Of the polymorphic loci, 14 had two alleles each, 10 had three alleles, and one locus had four alleles. Seven loci were monomorphic (AAT-2, GDA, GPI, GTDH, MDH-2, SOD-1, and SOD-2). The mean number of alleles per locus-colony area ranged from 1.4 to 1.1 and tended to be lower in colony areas south of the hybrid zone, i.e., south of COO20 (Table 4). Percent polymorphism (P) ranged from 12.5% at a L. o. occidentalis colony in northern California (CCY21) to 43.7% at two colonies within the hybrid zone (TAT11 in Washington and ESI17 in Oregon). Observed heterozygosity (H) ranged from 0.035 at PRO12 in Washington to 0.079 at FAR26 in California.
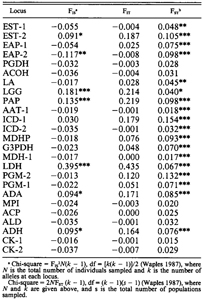
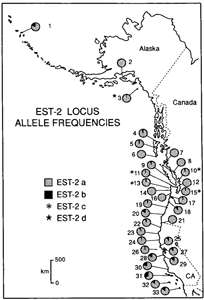
GEOGRAPHIC VARIATION The EST-2 locus illustrates a typical pattern of allelic variation in the Larus glaucescens-occidentalis complex (Fig. 5). In EST-2, the “a” allele is found in all populations, but tends to be fixed in northern colonies and decreases in frequency southwards. The EST-2b allele varies in a mosaic-like fashion across all colonies, but tends to increase in frequency southwards. The EST-2 allele is a rare allele found in four colonies in the hybrid and introgressive zones (SJI10, TAT11, DES13, and PUG15). A rare allele is defined here as an allele that is found in one or more, but not all, colonies (see also Slatkin 1985). Another rare allele, EST-2d, appears only at MIDD3 (L. glacescens). Allelic frequency differences between colonies were not great enough to demarcate exact geographic limits for the hybrid and introgressive zones. Principal components analysis of allelic frequency variation across all 33 colonies with morphotypes pooled indicate that colonies containing L. glaucescens occupy more multivariate space than those containing L. o. occidentalis, implying that L. glaucescens is genitally more variable than the other members of the complex (Fig. 6). Note that colonies containing more than 50% hybrids fall within the multivarite space of both putative parentals. The presence of rare alleles may indicate hybridization-induced variability (Woodruff 1989). Grouping colony areas into regions based on their relationship to the hybrid zone revealed that the average number of rare alleles per colony differed significantly between regions (F = 3.97, P = 0.029, df = 2, 30). Colonies in Alaska, British Columbia, and Washington (BULD1 to SJI10, plus PUG15) averaged 3.82 rare alleles per colony, colonies in the hybrid zone in western Washington and northern Oregon (TAT11 to COO20, excluding PUG15) averaged 2.44, and south of the hybrid zone, in pure L. occidentalis colonies (CCY21 to LCO33), the average was 1.15 rare alleles per colony. A general trend of increasing allelic diversity from one region of parentals (L. occidentalis) through the hybrid zone into the other region of parentals (L. glaucescens) suggests that introgression is unidirectional, in this case, directed towards L. glaucescens. GENETIC POPULATION STRUCTURE AND GENE FLOW Rogers’ (1972) and Nei’s (1978) genetic distance measures revealed low overall intercolony distances (data in Bell 1992; tables of intercolony genetic distances are available from the author). Roger’s D ranged from 0.007 (e.g., between TIL18 and MEN24) to 0.076 (between BULD1 and SNC32), and averaged 0.029 across all colony areas. Nei’s D showed similar patterns, but lower overall values. The mean intercolony genetic distance was 0.003, and ranged from 0.000 (between KACH2 and MIDD3) to 0.028 (between BULD1 and SNC32). Across all 33 colony areas with taxa pooled, single locus estimates of Fst were low, but significant, for 18 of 25 polymorphic loci, and Wright’s Iilsr a measure of potential inbreeding within populations (Wright 1951, 1965), was significantly greater than zero at seven loci (Table 5). Thus, although mean FST for all loci implies that only 8.2% of the total genetic variance is distributed among populations (Table 6), the L. glaucescens-occidentalis complex does not appear to be panmictic. Restricting the F-statistical analysis of colony areas with taxa pooled to most of the hybrid zone increases mean Fis from 0.032 to 0.099 (Table 6), suggesting that inbreeding is higher in mixed-taxon colonies within the hybrid zone than in single-taxon colonies outside of the hybrid zone. The estimated number of immigrants per colony generation (Nmest) for pooled taxa is 2.80. This value is consistent with moderately high rates of gene flow and agrees with low, yet significant, levels of overall genic heterogeneity among colonies. Chi-square goodness-of-fit and exact significance probability (Haldane 1954) tests detected departure from Hardy-Weinberg in several loci and colony areas (Table 7). Of these, the PAP locus was deficient in heterozygotes at three hybrid zone colonies (TAT11, GRA14, ESI17) and one L. o. occidentalis colony (CCY21). Although one or two departures may be expected due to chance (Cooper 1968), four significant departures from Hardy-Weinberg, three of which are in the hybrid zone, implies that mixed-taxon colonies are themselves not panmictic. Within the hybrid zone, the PAP aallele differs in frequency between L. glaucescens and L. o. occidentalis by 27% (Bell 1992), an amount which suggests that mating between the two taxa is not random, or at the very least, that gene flow between them is restricted. INTERSPECIFIC GENETIC DIFFERENTIATION There were no fixed allelic differences between a posteriori-classified taxa of the L. glaucescens-occidentalis complex, that is, they all shared at least one allele per locus (data in Bell 1992, tables of allelic frequency data are available from the author). Although heterozygosity is highest in L. o. wymani, L. glaucescens appears to be the most variable gull in the complex because it has the highest average number of alleles per locus and the greatest percent polymorphism (Table 8). Rogers’ (1972) genetic distance between morphotypes of the L. glaucescens-occidentalis complex averaged 0.022, and ranged from 0.011 (between L. glaucescens and hybrids) to 0.037 (between L. o. wymani and L. glaucescens). Nei’s D (1978) showed the same trend, albeit at much lower values (Bell 1992). Hybrids cluster with L. glaucescens in a UPGMA phenogram of Rogers’ D, indicating that they are genetically more similar to L. glaucescens than to L. occidentalis (Fig. 7). DISCUSSIONPHENOTYPIC VERIFICATION OF HYBRIDS Demonstration of phenotypic intermediacy is strong evidence in support of hybridization (Grant and Grant 1994). Although extensive overlap in allozymic and morphometric characters between L. glaucescens and L. occidentalis precluded their use in unequivocally identifying putative hybrids, discriminant function analysis, based on calorimetric traits, separated hybrid morphotypes as a group intermediate in canonical space between parental morphotypes. These results support the hypothesis that birds intermediate in coloration are in fact hybrids between L. glaucescens and L. occidentalis. In many species of gulls, hybrids have been identified largely on the basis of plumage melanism and its presumed intermediacy in intergrades (Patten and Weisbrod 1974, Strang 1977, Ingolfsson 1970, 1987, Hoffmann et al. 1978, Firsova and Levada 1982, Spear 1987). As an alternative hypothesis, Snell(1991b) has pointed out that phenotypic intermediacy can be explained by intraspecific clinal variation. However, known crosses between gull species confirm that mantle grayness in F, hybrids is intermediate between the parentals (Harris et al. 1978) and that inheritance of primary tip melanism is probably continuous and dominant to nonpigmented tips (Lönnberg 1919). Mantle and primary tip melanism appear to be under separate genetic control: Galusha (pers. comm.) photographed a partially leucistic L. glaucescens that had an all white mantle, yet normally pigmented primary-tips. In the Larus glaucescens-occidentalis complex, mantle and primary tip melanism are among the best discriminators of pure and intergrade gulls, although the inclusion of several additional characters such as bill, eye-ring and iris pigmentation improve the accuracy of hybrid determinations. RELATIVE VARIABILITY The low level of genetic variability detected in the L. glaucescens-occidentalis complex is comparable to that found in other larids (Tegelström et al. 1980, Johnson 1985, Karlet al. 1987, Randi and Spinna 1987, Snell 1991a). However, within the complex, L. glaucescens has a higher percentage of polymorphic loci and its colonies occupy more space in a multivariate plot of gene frequencies than other members of the complex. In addition, L. glaucescens colonies located north of the hybrid zone have significantly more rare alleles than colonies to the south. Thus, L. glaucescens appears to exhibit greater allelic diversity than the other members of the complex, including hybrids. This seems to contradict the theory of contact zones wherein hybrids are expected to reveal greater electromorphic variability than parentals due to an increase in heterozygosity, an increase in the appearance of rare alleles (= hybrizymes), and an increase in the mutation rate (Barton et al. 1983, McClintock 1984, Woodruff 1989). Since L. glaucescens may hybridize with up to four other species of gull, its elevated electromorphic variability may simply be a reflection of extensive introgression originating from the four geographically disparate hybrid zones, and this introgression may be expressed as diffusing alleles and hybrizymes arising de novo through intragenic recombination and mutation. The amount of genetic variation observed in any one hybrid zone is less than the overall variability of the introgressed parental species. CLINAL VARIATION AND GENE FLOW In the L. glaucescens-occidentalis complex, sizerelated characters exhibit little, if any, clinal variation. Larus glaucescens from the Aleutian Islands is significantly larger than conspecifics from elsewhere, and this may be due in part to introgressive hybridization with a larger species, L. hyperboreus, in the Bering Sea region (Strang 1977). Specimens of L. o. wymani from the Channel Islands tend to be the smallest gulls in the complex (Bell 1992). Plumage melanism and eye-ring color vary in a stepwise manner across geography. Abrupt changes in color character means over relatively short geographic distances are found both within and between morphotypes, implying that gene flow may be restricted between the groups in question (Endler 1977). Although it is very difficult to demonstrate whether a given cline has been shaped by the process of natural selection or genetic drift (Endler 1982) concordant steps in several colorimetric characters along the western Washington coast suggests that this region represents a secondary contact zone between L. glaucescens and L. occidentalis. Variable loci in the L. glaucescens-occidentalis complex exhibit shallow clinal variation across broad geographic distances. Shallow clines across great distances imply that alleles are diffusing freely and are not subject to selection of any great magnitude or, if selection is operative, that random genetic drift is obscuring its effects (Barton and Hewitt 1989). Because of the broad nature of the allelic clines and erratic shifts in allelic frequencies between islands, the exact location of the hybrid and introgressive zones in the L. glaucescens-occidentalis complex could not be pinpointed with protein electrophoretic methods. Estimates of gene flow between populations of the L. glaucescens-occidentalis complex are comparable to those of other gulls (see Snell 1991a). The estimate obtained here for Nm (2.99 immigrants per generation) indicates moderately high gene flow. Nevertheless, under the steppingstone model, which best approximates the linear arrangement of colonies in the L. glaucescens-occidentalis, gene flow rates of between 1 and 4 per deme still permit significant differentiation to occur (Kimura and Maruyama 1974). As Snell(1991a) points out, a pattern of moderately high gene flow is consistent with other non-exclusive hypotheses: Genetic variability and cluster analyses suggest that electromorphic introgression is skewed towards L. glaucescens. Calorimetric data support the notion that introgression across the hybrid zone is largely unidirectional: whereas the southem borders of the hybrid and introgressive zones coincide, the northern borders do not. The zone of introgression extends much further north into the range of L. glaucescens. The evidence implies that L. glaucescens is becoming more introgressed than L. o. occidentalis. However, because several loci within the hybrid zone depart from Hardy-Weinberg proportions and F statistical analyses point to greater inbreeding within the hybrid zone, gene flow across the hybrid zone is clearly impeded. Departure from Hardy-Weinberg is sometimes considered to be a consequence of the Wahlund Effect, that is, a lack of heterozygotes due to the recent mixing of isolated populations of differing allelic frequencies (Hedrick 1983). In this case, Wahlund’s Effect is not operative because the populations in question have been hybridizing to varying degrees at least since the early 1900’s (Dawson 1909). Thus, the L. glaucescens-occidentalis hybrid zone corresponds to a partial barrier to gene flow, and the gene flow that does occur is largely skewed towards L. glaucescens. Skewed introgression is manifested as greater variability in L. glaucestens. Patten (1980) hypothesized that gene flow may be proceeding from L. argentatus to L. glaucescens in southeastern Alaska, due in part to decreased fitness of hybrids at inland nesting areas favored by L. argentatus. I hypothesize that a similar mechanism may be operational in the L. glaucescens-occidentalis hybrid zone. Hybrids may experience reduced fitness in L. o. occidentalis habitat south of the hybrid zone. On a proximal level, hybrids could prefer glaucescens-habitat and consequently have a greater tendency to disperse into the fjord-like areas north of the hybrid zone. In the genus Manacus secondary sexual traits have been found to spread unidirectionally across the hybrid zone between White-collared and Golden-collared Manakins (Parsons et al. 1993). Parsons et al. (1993) found that sexual selection may be responsible for driving male plumage traits across this hybrid zone despite impeded gene flow. The authors suggest that the hybrid zone may serve as a conduit for advantageous traits to spread between species without affecting the putative genetic integrity of the locally adapted populations or species. Although the selective basis is entirely unknown, an analogous situation may be occurring in the L. glaucescens-occidentalis complex. In spite of the fact that L. glaucescens is at population-genetic equilibrium (Slatkin 1993), it appears to exhibit elevated levels of hybridization-induced genetic variability. STABILITY OF THE HYBRID ZONE There are several caveats involved in directly comparing the surveys of Hoffman et al. (1978) with the present study. First, Hoffman et al. (1978) restricted their surveys of the hybrid zone to the outer Washington coast and Oregon; comparative data from British Columbia, the inland waterways of Washington and the south-central coast of Oregon are entirely lacking. Second, they used a hybrid index with varying levels of precision to categorize gulls in the field. Third, the only specimens they observed in the hand were trapped on Destruction Island and then released. Given these caveats, it nevertheless appears that the hybrid zone has expanded in the 10-15 year interval since the work of Hoffman et al. (1978). The proportion of intergrades at colonies in the hybrid zone has increased, and both parental species have expanded their breeding ranges across the zone. In the present study, L. o. occidentalis was collected as a breeding bird from colonies as far north as Tatoosh Island (TAT11) and as far east as Protection Island (PRO12) in Juan de Fuca Strait. Larus glaucescens was collected from nests as far south as Coos Bay, Oregon (COO20). Although the hybrid zone appears to have expanded, it does exhibit elements of stability. The main region of sympatric overlap is still located along a 180 km portion of the outer Washington coast, the midpoint of the zone, located near Grays Harbor, Washington, has not shifted, and the relative proportion of morphotypes in colonies at the midpoint has remained the same. The fact that pure parentals of both species can be found at all colonies in the hybrid zone suggests that a hybrid swarm is not developing. The present day overlap of L. glaucescens and L. o. occidentalis (up to 745 km of coastline) is much greater than it was in the early part of this century. Dawson (1908, 1909) noted mixed colonies of these two species along the outer Washington coast from Destruction Island north to Carroll Island, a distance of about 50 km. At that time the level of hybridization between these two species appears to have been minimal (Finley 1905, Dawson 1908, 1909). Furthermore, the hybrid zone does not seem to have changed much in the first half of this century (see Jewett et al. 1953). It appears that the hybrid zone began to expand as gull populations increased after World War II, thanks to reduced persecution and an increase in food resources such as garbage and fisheries by-products (Reid 1988). In the last 50 years the population of L. glaucescens in British Columbia has increased 3.5-fold (Campbell et al. 1990), while L. o. occidentalis has experienced population increases along the outer Washington coast (Speich and Wahl 1989). Thus, expansion of the hybrid zone in the latter half of this century may be a direct consequence of increasing gull populations. ZOOGEOGRAPHY AND INFERRED PLEISTOCENE SCENARIOS The present-day breeding distribution of L. glaucescens maps a marine environment that is characterized by complex fjord and estuarine circulation patterns and is subject to fluctuating salinity gradients (Thomson 1989). The hybrid zone between L. glaucescens and L. occidentalis occurs at the transition between two distinct marine-zoogeographical provinces-the northern Aleutian and southern Oregon provinces (Udavardy 1978). In contrast to the Aleutian Province, the cold-temperate Oregonian Province is influenced by the southward-progressing California Current (Seapy and Littler 1980). The California Current, together with the wind-induced upwelling so characteristic for the Oregon and California coasts in spring and early summer, act to greatly increase ocean productivity (Huyer 1983). The distribution of L. o. occidentalis maps exactly the coastal upwelling ecosystem of westem North America. The close correspondence between population distribution and marine-zoogeographical province implies that each of these gull taxa have adapted to and tracked different environmental conditions during their evolution. Most of the area where present-day L. glaucescens and L. occidentalis overlap was inundated by the southern portions of the Cordilleran Ice-sheet at the height of the Late Wisconsin Drift in North America, roughly 18,000 yr B.P. (Waitt and Thorson 1983). The ice sheet covered all of Vancouver Island and Juan de Fuca Strait extending beyond Cape Flattery and filling the entire Puget Sound basin. Since very few larids are adapted to a sea ice environment (Divoky 1979), the distributions of these two species were probably separated by glacial fronts. Larus glaucescens was likely situated to the north, in ice-free coastal refugia postulated for the Bering Sea coast, Kodiak Island or the Queen Charlotte Islands (Lindroth 1969, Heusser 1989); while L. occidentalis may have been forced well south of Juan de Fuca Strait (see also Hoffman et al. 1978). Global sea level changes ranging up to 100m during glacial maxima (Clague 1989) may have created additional refugia on the continental shelf or coastal seamounts. As glacial meltdown progressed from 18,000 to 12,000 yr B.P., the Columbia River was subject to catastrophic flooding (Bretz 1923). Flooding was so great that it likely wiped out gull nesting habitat in western Washington. It may also have temporarily eliminated coastal upwelling. In effect, the Columbia River could have acted as a barrier to northward range expansion by L. occidentalis at the beginning of the Holocene. Contact between the two species was probably not established until well after 10,000 yr B.P., when ocean waters began filling Puget Sound (Waitt and Thorson 1983). The geological history of the Pacific Northwest implies then, that L. glaucescens and L. occidentalis may have gone through multiple bouts of secondary contact followed by separation. Thus, hybridization probably occurred during each contact episode, but did not proceed far enough to swamp either species. Habitat alteration by humans in the last century may have further promoted contact between these two species, and each bout of hybridization may have effectively increased the genetic diversity in at least one of the hybridizing taxa - L. glaucescens. The L. glaucescens-occidentalis complex may thus serve as a prime example of the role hybridization plays in enabling gene exchange to occur between species and thereby increase genetic variability. ACKNOWLEDGMENTS Field work for this project could not have been accomplished without the kind and generous help of many individuals. Although they are too numerous to name here, I thank them all. The Burke Museum, University of Washington, loaned specimen material. In addition, the following marine labs and institutes greatly facilitated fieldwork: San Diego Natural History Museum; Hubbs-Sea World Research Institute; U. S. Navy Pacific Missile Test Center; University of California Natural Reserve System; Long Marine Laboratory; Hopkins Marine Station; Moss Landing Marine Laboratory; Point Reyes Bird Observatory; University of California Richmond Field Station; Bodega Bay Marine Laboratory; Fred Telonicher Marine Laboratory; Oreaon Institute of Marine Biologv: Hatfield Marine Science Center; Friday Harbor La&atories; Walla Walla College Marine Station; Bamfield Marine Station; Pacific Biological Station; University of British Columbia Research Farm. Collecting permits were issued by the state fish and game departments of Baja California Norte, California, Oregon, Washington, and Alaska. The U.S. Fish and Wildlife Service and the Canadian Fish and Wildlife Service issued collecting permits, as did the U.S. Denartments of the Army. Navy. Treasury, and Agriculture. Several units of the National Wildlife Refuge System, the National Park Service, the state parks of California, Oregon, Washington, and Alaska, and Provincial Parks of British Columbia issued research permits. I especially thank the Makah Nation and the Haida Nation for allowing me to work on their lands. Financial assistance was provided by grants from Sigma Xi-The Scientific Research Society, the Frank M. Chapman Memorial Fund of the American Museum of Natural History, the Wilhelm F. Martens and Kellogg Research Grant-in-Aid programs of the Museum of Vertebrate Zoology, The Tinker Foundation, the U. C. Berkeley Center for Latin American Studies, the U. C. Berkeley Graduate Division, and a National Science Foundation Doctoral Dissertation Improvement Grant (BSR89-01328). Field work on Tatoosh Island was supported by National Science Foundation grants OCE 8415707 and OCE 8614463 to Robert T. Paine. Karen Klitz assisted in preparation of the figures. Sylvia Hope, Robin L. Lawson, Raymond Pierotti, James D. Rising, Richard Snell, Robert M. Zink and two anonymous reviewers provided critical reviews of various versions of this manuscript. I thank Ned K. Johnson for his years of input as my thesis advisor. The author was supported by a Tilton Postdoctoral Fellowship from the California Academy of Sciences and a grant from the Ann and Gordon Getty Foundation during preparation of this manuscript. I am grateful to all of the above for their assistance. Special thanks to Bob Jones for his indefatigable help. LITERATURE CITED & APPENDIX 1 See PDF. |
Glaucous-winged Gull glaucescens | |||||||||||||||||||||||||||||||||||||||||||||||||||||||||||||||||||||||||||||||||||||||||||||||||||||||||||||||||||||||||||||||||||||||||||||||||||||||||||||||||||||||||||||||||||||||||||||||||||||||||||||||||||||||||||||||||||||||||||||||||||||||||||||||||||||||||||||||||||||||||||||||||||||||||||||||||||||||||||||||||||||||||||||||||||||||||||||||||||||||||||||||||||||||||||||||||||||||||||||||||||||||||||||||||||
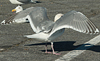
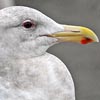 Glaucous-winged Gull glaucescens adult, January 22 2011, Ediz hook, WA. Picture: Slater Museum. Glaucous-winged Gull glaucescens adult, January 22 2011, Ediz hook, WA. Picture: Slater Museum. |
|||||||||||||||||||||||||||||||||||||||||||||||||||||||||||||||||||||||||||||||||||||||||||||||||||||||||||||||||||||||||||||||||||||||||||||||||||||||||||||||||||||||||||||||||||||||||||||||||||||||||||||||||||||||||||||||||||||||||||||||||||||||||||||||||||||||||||||||||||||||||||||||||||||||||||||||||||||||||||||||||||||||||||||||||||||||||||||||||||||||||||||||||||||||||||||||||||||||||||||||||||||||||||||||||||||
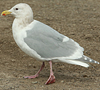 Glaucous-winged Gull glaucescens adult, January 15 2017, San Leandro, California. Picture: John Cant. Glaucous-winged Gull glaucescens adult, January 15 2017, San Leandro, California. Picture: John Cant. |
|||||||||||||||||||||||||||||||||||||||||||||||||||||||||||||||||||||||||||||||||||||||||||||||||||||||||||||||||||||||||||||||||||||||||||||||||||||||||||||||||||||||||||||||||||||||||||||||||||||||||||||||||||||||||||||||||||||||||||||||||||||||||||||||||||||||||||||||||||||||||||||||||||||||||||||||||||||||||||||||||||||||||||||||||||||||||||||||||||||||||||||||||||||||||||||||||||||||||||||||||||||||||||||||||||||
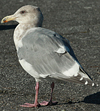 Glaucous-winged Gull glaucescens adult, January 15 2017, San Leandro, California. Picture: John Cant. Glaucous-winged Gull glaucescens adult, January 15 2017, San Leandro, California. Picture: John Cant. |
|||||||||||||||||||||||||||||||||||||||||||||||||||||||||||||||||||||||||||||||||||||||||||||||||||||||||||||||||||||||||||||||||||||||||||||||||||||||||||||||||||||||||||||||||||||||||||||||||||||||||||||||||||||||||||||||||||||||||||||||||||||||||||||||||||||||||||||||||||||||||||||||||||||||||||||||||||||||||||||||||||||||||||||||||||||||||||||||||||||||||||||||||||||||||||||||||||||||||||||||||||||||||||||||||||||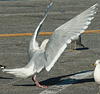
| Olympic Gull glaucescens x occidentalis | |||||||||||||||||||||||||||||||||||||||||||||||||||||||||||||||||||||||||||||||||||||||||||||||||||||||||||||||||||||||||||||||||||||||||||||||||||||||||||||||||||||||||||||||||||||||||||||||||||||||||||||||||||||||||||||||||||||||||||||||||||||||||||||||||||||||||||||||||||||||||||||||||||||||||||||||||||||||||||||||||||||||||||||||||||||||||||||||||||||||||||||||||||||||||||||||||||||||||||||||||||||||||||||||||||||
 Glaucous-winged Gull glaucescens